


6 Start up Tips for Autochartist
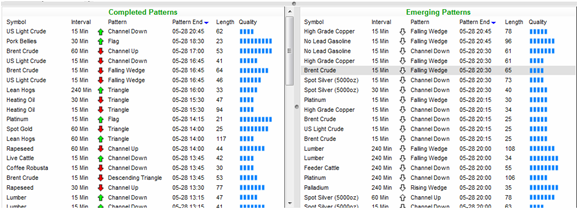
To best navigate the Autochartist platform and get the most from the pattern alerts there are a few key areas of the application to get to know first. Let’s look at an example. Below is an Emerging Pattern alert found on the results column located at the left side of the interface.
Using an Emerging Pattern alert allows for a proactive trading approach. Emerging patterns are signaled before price action pierces either the support or resistance of the formation. There are also some very important Quality Indicators that will further confirm or filter results depending upon the pattern type, trend, and price action. This removes much of the subjectivity in chart pattern trading and allows for unbiased trading.

The first thing to note is that this Brent Crude alert is on the 15 minute intraday time frame. This can be seen on both the alert line and the chart itself. Autochartist scans across the 15, 30, 60, 240 and 1440-minute time frames. So this 15-minute chart (I) represents the largest time frame that Autochartist will alert pattern results for. The pattern type (P) is also listed on the chart, as well as the potential direction (D) of the pattern break. A falling wedge is a trending pattern -- discussion of the different pattern types and their set ups follows later in this series.
For now realize that this Falling Wedge is an downtrending pattern occurring on the short term intraday chart of Brent Crude. The Initial Trend (T) will help confirm the strength of the current trend and for a trending pattern to continue, it is best if the Initial Trend reading is six bars or greater. (The maximum reading is ten.) With this example it can be said that the reading is five bars, indicating sideways volatility. However, one more bar would signal a transition to a trend.
The Initial Trend reading will be one of the most important Quality Indicators within your pattern filtering process.
Completed Patterns are listed in the column on the left side of the interface. If Emerging Patterns are proactive alerts, the Completed Patterns are reactive and trade management alerts.
The filtering process that is discussed throughout this series is important in obtaining the most from the alerts that are streaming throughout the day. Each trader must understand the set of criteria best for aggressive to conservative entries. Later in the series there is also an in-depth discussion of how to set up custom scans to best reflect individual trading approaches.
Let’s take a look at a Completed Pattern alert for Brent Crude also on the 15-minute time frame. Remember that the differences between Emerging and Completed Patterns are:
- Whether or not the price action broke the pattern with momentum (see Breakout);
- and The Forecast area that will plot on Completed Pattern alerts.
It should be mentioned that there are times when the Emerging Pattern alerts will show a break of the pattern. This has to do with the fact that Autochartist updates the price on the 15 minute chart every 15 minutes. If this were a 60 minute chart, the price would be updated at the top of every hour as long as the pattern is valid.

The Breakout reading (B) offers insight into the momentum with which the pattern broke the support of the wedge pattern in this case. Since the Breakout reading is very high with the maximum of ten bars there is strong momentum as prices break lower and thus there will be a high expectation of immediate follow-through. Remember if the pattern breaks before an economic event or before a financial center opening like Sydney or New York, there could be significant follow-through later.
The Completed Alert shows the grey Prediction area (outlined) at the bottom right of the chart. This level is support since it is plotted below the price breakdown. The other outlined area shows the prices that make up the Prediction area. In this case it is from 7426.4626 to 7327.7103. The Prediction area price forecasts offer guidance for trade management which makes Completed Patterns valuable once an entry is taken.