


6 Start up Tips for Autochartist
For all trading styles understanding the trend of the market is key. To get the most effective chart pattern set up the direction and strength of the trend must be known.

There are basically two types of chart patterns: trending and non-trending. Trending pattern types on the Autochartist platform are rising and falling wedges, channel up and down patterns, as well as head and shoulders patterns with more angle necklines; and some flag formations.
Flag formations and head and shoulders patterns can be found and traded in other market cycles. Wedges and channels are strictly trending patterns that should be set up ideally with medium to high Initial Trend readings.
Wedges and channels reveal the psychology of a trend in terms of the lines and levels that shape them. The lines and levels in these are either a pair of uptrend lines or a pair of downtrend lines.
The higher lows of an uptrend (support) is the backbone of an uptrending pattern and is considered a “decision level” since the formation relies on continued support. Conversely the lower highs (resistance) of a downtrend is the backbone of a downtrending pattern. It’s the higher downtrend line that keeps pushing prices lower.
Let’s look at examples of both uptrending and downtrending patterns.
This first chart is an uptrending Channel Up Emerging Pattern, as prices trend higher with a strong Initial Trend. A trend is indicated by an Initial Trend reading of six bars or greater. The support or “backbone” of the pattern has been tested twice as prices traded down to the uptrend line support. This shows excellent confirmation of the pattern’s quality. The high Initial Trend reading of ten bars confirms that the pattern is developing within a trend.

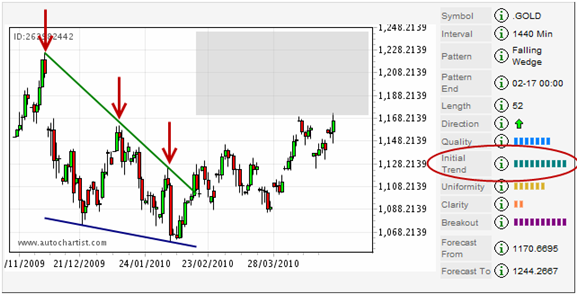
Next is an example of a downtrending pattern. In this Channel Down Completed Pattern the alert shows a very high Initial Trend reading thus confirming an underlying trend as the pattern was developing and subsequently broken.
Do keep in mind that all trending pattern alerts will not have a high Initial Trend reading. This is because the lines and levels that form a pattern can develop within any market cycle but this does not mean it is an ideal trading set up.
The different alerts make provision for traders with different tolerances for the strength of a trend. Just because a pattern is not necessarily a perfect pairing for the underlying market cycle does not mean that the lines and levels are without merit! In this case, the downtrend line resistance could be very helpful to identify a breakout to the upside.
Because the Initial Trend reading is low the underlying trend is likely to be weak or not even a trend at all. This would mean that a better pattern to keep an eye out for would be a triangle or rectangle.
There are three potential entries on any trending pattern to determine the ideal set up. Part of this is seen in the strength or weakness of the Initial Trend. For high Initial Trend readings, look for the continuation of the trend and capitalize on the follow-through.
Either:
- Short the downtrend line resistance of a falling/down pattern;
- Get long at the uptrend line support of a rising/up pattern.
These entries would be considered “swing” entries since they take advantage of corrections within the trend. The other alternative with trending pattern alerts with a high Initial Trend is the breakout or breakdown. This is where the pattern does not correct and breaks lower through the downtrend line support of a falling/down pattern or breaks higher through the uptrend line resistance of a rising/up pattern.
Both these entries would be considered “continuation”. With low Initial Trend readings where the bars are medium, look for a potential stall or a reversal of the trend. This would mean that the “backbone” may be “broken” as the trendline is pierced. Even though these are likely entry scenarios, remember that any Initial Trend reading could lead to a continuation or reversal.