


6 Start up Tips for Autochartist
Non-trending patterns are powerful ways to capitalize on the indecision or confusion in the market. However knowing whether the market is undergoing indecision or confusion is the key to knowing how to react to the decision levels on the chart.
Consolidation and congestion can be seen in sideways range-bound markets. There are two types of sideways markets: accumulation and distribution. The Initial Trend reading will help to identify this important distinction.
Trading sideways markets is all about identifying a range-bound market that has no trend. However it is also important to understand whether resistance and support should be traded with a breakout/breakdown strategy or with a fading strategy.
Trading with breakout/breakdown strategies is also known as “momentum” trading. This involves waiting for price action to pierce the support or resistance of patterns such as triangles, rectangles, and pennants.
These patterns are best traded when the market cycle is in accumulation and the Initial Trend reading is either one to three or four to five vars. This indicates a range-bound, sideways market. Many times these patterns may begin developing within a distribution cycle (four to five Initial Trend bars) but transition into accumulation (one to three Initial Trend bars).
What happens if the Initial Trend is four to five bars indicating distribution?
Distribution cycles are differentiated from accumulation cycles by the way the market is moving sideways. Accumulation cycles are quiet, narrow ranges indicated by a one to three bar Initial Trend reading. Distribution cycles by contrast are wider and more volatile while moving within a range; they are also accompanied by a higher Initial Trend reading of four to five bars.
If the Initial Trend reading is one to five bars, the market is sideways. The lower the reading is, the more likely it is accumulation; if the reading is closer to medium it’s either distribution or a weak trend.
While this process of establishing a trend is not completely objective, there are other ways of validating it. You can also look at the pattern’s shape and angle to help clarify the market’s direction. To trade a distribution cycle “fade” -- which basically means shorting resistance or buying support – the pattern needs a horizontal support or resistance level. These are often called “floors” or “ceilings”. This specifically means that rectangles, ascending triangles, and descending triangles are patterns that can be set up for a distribution cycle “fade”.
When the Initial Trend reading is one to three bars, the entry relies on a show momentum higher or lower through the pattern. This entry is called an Autochartist Initial Movement-Momentum or A.I.M.
When the reading is four or five bars this opens the door to a fade off the horizontal line or “floor” of the descending triangle pattern. This entry known as an Autochartist Inside the Range or A.I.R. entry is an aggressive trade set up.
Not all support levels will hold prices within the pattern. For further confirmation of this you can use key price levels and the Breakout reading. When the reading is very high as in this example, the higher momentum at the time of the breakdown suggests that there will be a high negative sentiment at the pattern break.
Conversely, for Initial Trend readings of four to five bars with a high Breakout reading there is always the chance for continued follow-through so it is recommended to keep a tight stop-loss (10 to 12 pips) on any fade off a floor or ceiling.
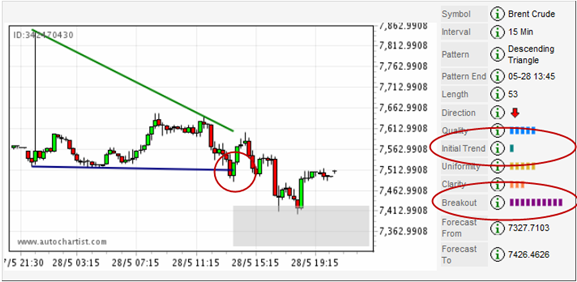
In the above pattern alert the Initial Trend reading is just one bar confirming a narrow, sideways accumulation cycle. The breakout through the Triangle pattern’s downtrend line resistance is seen here following through well from the consolidation of the pattern. The momentum the pattern broke with was moderate as indicated by the four bar Breakout reading. This is known as an Autochartist Initial Movement-Momentum or A.I.M. entry. Notice the high Breakout reading as well suggesting strong negative sentiment or selling momentum.
Remember that sideway patterns can break in either direction. This example illustrates that there is no way to be 100% sure that a pattern will reverse or follow through until price choose a direction. In the end every trading approach needs a solid risk management strategy. Understanding pip movement and volatility at the time of entry is the first step.
Another popular way to filter breakouts or breakdowns from fades is to use basic indicators like the MACD Histogram to confirm price movement. Remember that chart patterns and Quality Indicators are meant to point to a possible set up. Follow-through and volatility must be determined at the time of entry and throughout the position. This is done by studying time together with economic data releases.